Statistics - Bar graph
The graph below shows the weekly sales volume of a store (unit: number of items). Select the correct answer by looking at the graph.
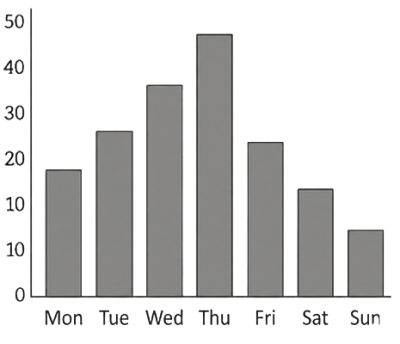
Which day had the highest sales?
Which day had the highest sales?
A
Mon
B
Thur
C
Wed
D
Fri
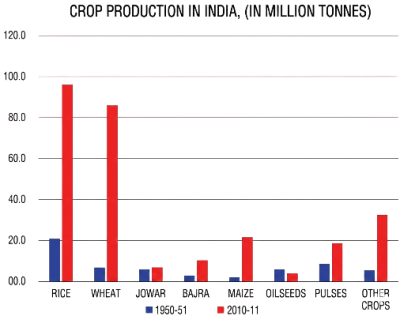
Which crop had the highest increase in production between 1950-51 and 2010-11?
A
Rice
B
Wheat
C
Millet
D
Cotton