Statistics - Bar graph
The graph below shows the weekly sales volume of a store (unit: number of items). Select the correct answer by looking at the graph.
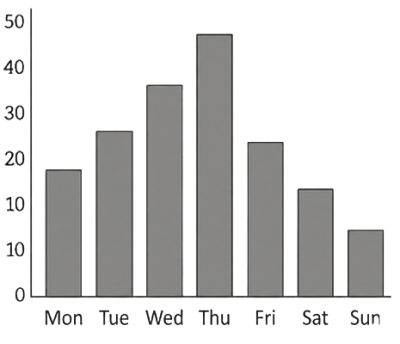
Which day had the highest sales?
Which day had the highest sales?
Explanation
Thursday sold 50 items, the highest of the week.
Like
0
Correct
4
Wrong
0