सांख्यिकी - स्तंभलेख वाचन
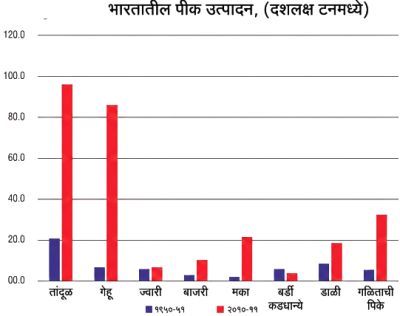
1950-51 आणि 2010-11 मध्ये कोणत्या पिकाच्या उत्पादनात सर्वाधिक वाढ झाली?
Explanation
तांदूळ: 95 – 20 = 75
गहू: 85 – 6 = 79
ज्वारी: 6 – 5 = 1
बाजरी: 10 – 2 = 8
मका: 21 – 2 = 19
कडधान्ये: 3 – 5 = –2 (घट)
ऊस: 18 – 7 = 11
कापूस: 32 – 5 = 27सर्वाधिक वाढ = गहू = 79
गहू: 85 – 6 = 79
ज्वारी: 6 – 5 = 1
बाजरी: 10 – 2 = 8
मका: 21 – 2 = 19
कडधान्ये: 3 – 5 = –2 (घट)
ऊस: 18 – 7 = 11
कापूस: 32 – 5 = 27सर्वाधिक वाढ = गहू = 79
Like
0
Correct
0
Wrong
0