Introduction
A Venn diagram is a visual representation used to show the logical relationship between sets. It uses overlapping circles or other shapes to illustrate how much different groups have in common.
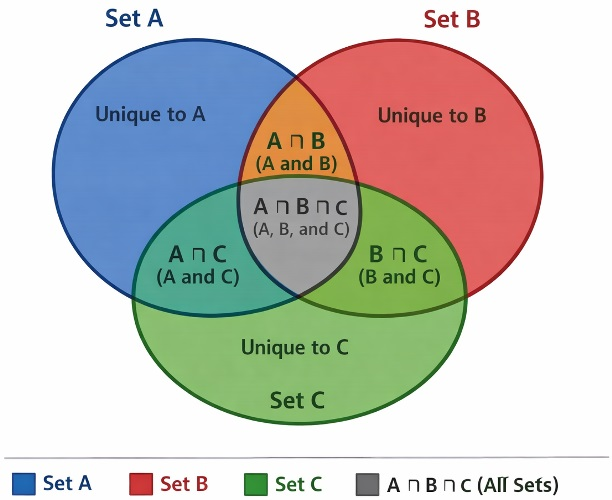
A Venn diagram helps in identifying common properties between different sets of data.
Explanation Step by Step
To solve a Venn diagram puzzle, first identify the relationship between the given words. Are they subsets of each other? Do they overlap? Or are they completely different? Once determined, select the circles that best represent this logic.
Sub-topics
Puzzles and Brain Teasers - Venn Diagram
This sub-topic focuses on using diagrams to solve logical problems and categorize items based on shared traits.
Examples
Example 1: Mammals, Cows, Crows
Tricks and Shortcuts
Look for keywords like 'All', 'Some', or 'No'. 'All' implies one circle inside another, while 'Some' implies overlapping circles.
Common Mistakes
Do not assume relationships that don't exist. For example, not all doctors are engineers, even if they are both professionals.
Practice Questions
Easy Questions
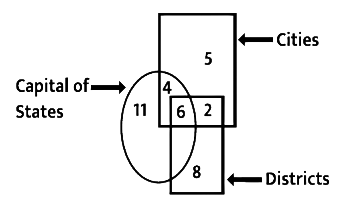
- How many cities are also capitals of states?
- How many districts are neither cities nor capitals of states?
- How many regions belong to all three categories: cities, districts, and capitals of states?
Medium Questions
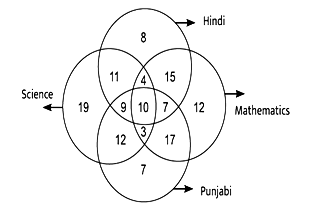
- What is the number of students studying only Mathematics and Hindi ?
- What does the number 3 represent?
- How many students study every subject?
Hard Questions
In the Venn diagram below - circle represents educated people, square - women, triangle - single people and rectangle - athletes. Each segment is numbered.
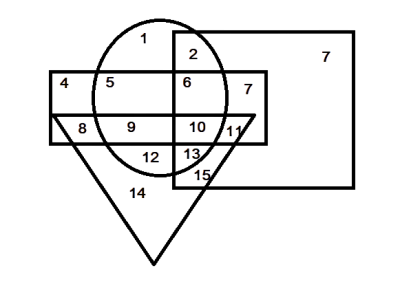
- How many educated women are athletes ?
- How many single people are educated ?
- Which of the following segments is represented by the number 11?
Revision Summary
Venn diagrams are essential for logical reasoning. They simplify complex data by showing intersections and unions of different categories.
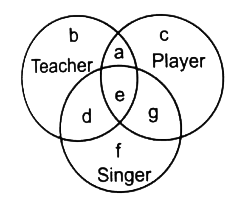
Players who are singers but not teachers